
Calculating Expected Values with Unequal Probabilities in Excel
One of my main focuses in improving my analytical capabilities is mathematical probability and statistics. Here's something I'm particularly enjoying. Below is my solution for the following word problem:
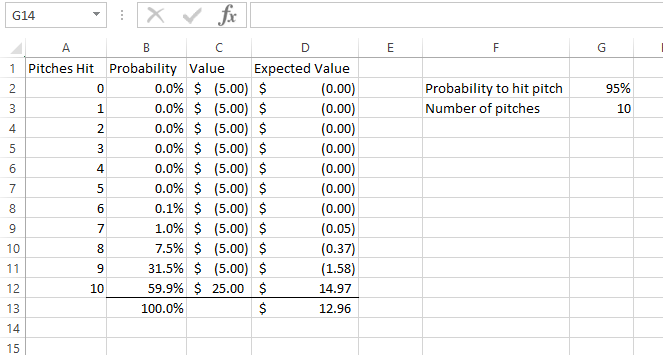
"The Slow Ball Challenge: There will be 10 pitches, each at 60 mph. Tyrell estimates that he will hit each individual pitch 95% percent of the time. If Tyrell can hit all 10 pitches, he will win a total of $25; otherwise he will lose $5."
I set up a table in excel to help illustrate my solution to the problem.
I was familiar with doing this type of probability calculation when the outcomes were of equal value, such as flipping a coin, but it was more difficult when we add the additional factor of events with unequal probability. In this case, instead of using a simple combinatoric formula and dividing by total outcomes, we needed to use a binomial distribution. Therefore, the formula we will use to determine probability will be:
Cn,k(Pk)*(1-P)n-k
I set this up in excel by listing my values for P and n in column G as they will remain static and referencing column A for the variable k.

We no have a working template to calculate expected value when the probability of expected outcomes is unequal.


